Using Multiple Indicators in forex protects you from several fake signals.Most traders use the technical indicators in their trading strategies to help them make decisions on whether to enter or exit trade.
We previously looked at different categories of indicators. Namely;

The Trend following indicators
Such as the moving average, Parabolic SAR.
The trend following indicators will help you to know where the trend is heading.
For example, a moving average is a trend following indicator. You can predict where price will go by just looking at the slope of a moving average . You can also use moving average crossover for entry signals
The Volatility indicators;
The bollinger bands measure market volatility. When the bands expand, it shows high volatility and when they contract, the show low market volatility.
Momentum indicators
e.g. the ADX, RSI, Stochastics and MACD.
The momentum indicators tell you the strength of a trend. You are able to identify the over bought and oversold conditions in the market. This way you will be able to tell when a trend is likely to end.
Momentum indicators also help you to prepare for the new trend ahead.
With this kind of information, it becomes easy to determine your entry and exit points.
Advantages of using multiple indicators in forex
When you use more than one indicator, you remove the bias of one indicators because you will compare information from different indicators.
Each indicator has its own set of weaknesses. If you only use a single indicator to monitor the market, there may be certain price trends that you are likely to miss.
You also expose yourself to many fake signals.
By combining multiple indicators in forex into a single trading strategy, you limit the risk of fake signals and premature stops.
However, using multi-indicator to trade has its fall outs when not used well.
Many times traders use indicators that show the same type of information. When you use multiple indicators of the same category, it like trading with just one of them.
Why?
Because, they display the same information!!
To avoid this, you need to understand the different classes of technical indicators. This will help you to combine indicators that show a different type of information.
For instance, you can use;
A trend following indicator with a momentum indicator.
Or a volatility indicator with momentum indicator.
We shall now see how to combine these multiple indicators in forex to make a good strategy to trade.
Now that we have learnt the different chart indicators and how to use them, let’s look at different indicators when combined together.
How to combine MACD with Moving Average Cross over for entry signals
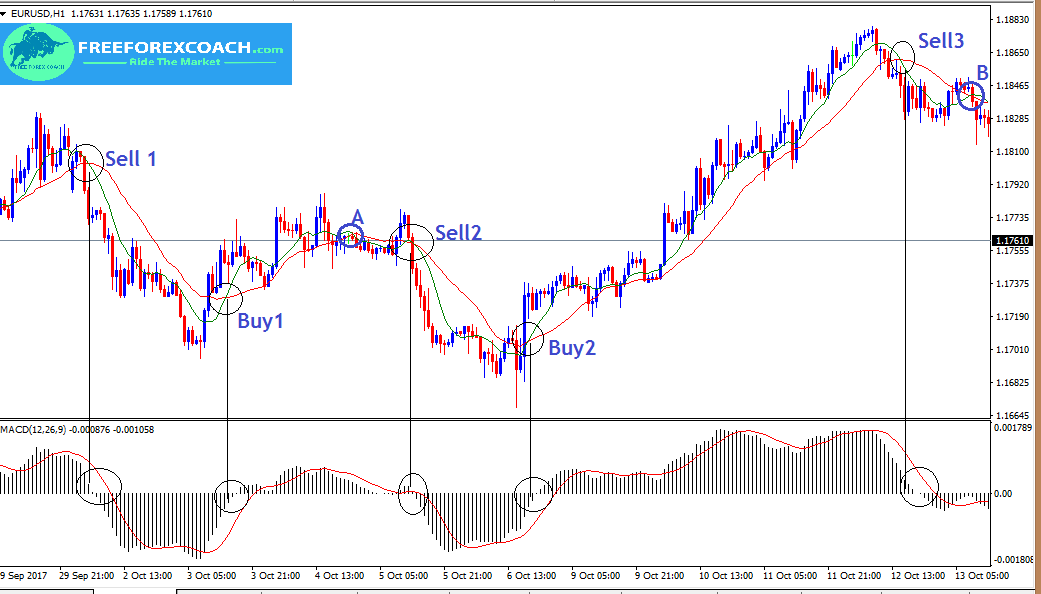
Here is an example on EUR/USD hourly chart.
The Simple Moving Averages used are 9 SMA and 21 SMA and MACD is to its default settings.

As we discussed in the previous sessions,
MACD gives signals when the histogram and signal line cross the zero line.
In correspondence with the moving average, we are mostly interested in moving average crossovers.
This means, our trading signal is valid only when the MACD histogram crosses the Zero line as the moving Averages cross.
From the chart above,
The sell and buy signals are only when moving averages crossover and MACD histogram crossing the zero line.
Therefore, A and B crossovers in this case are not valid signals because the the MACD did not give a signal too.
All in all, enter trades when both indicators give signal at same time. EXit/Take profit immediately when there is Moving average crossover.
Let’s take a look at another example.
Combining Bollinger bands with Relative Strength Index (RSI)
Just a small reminder on the Bollinger bands:
As the bands contract, it signals a reduction in volatility which may lead to a sideways direction or congestion.
On the other hand, if the bands expand, it signals an increase in volatility which may lead to a strong rally of prices either in an uptrend or downtrend.
So, how do we combine Bollinger bands and RSI to identify entry and exit price levels?
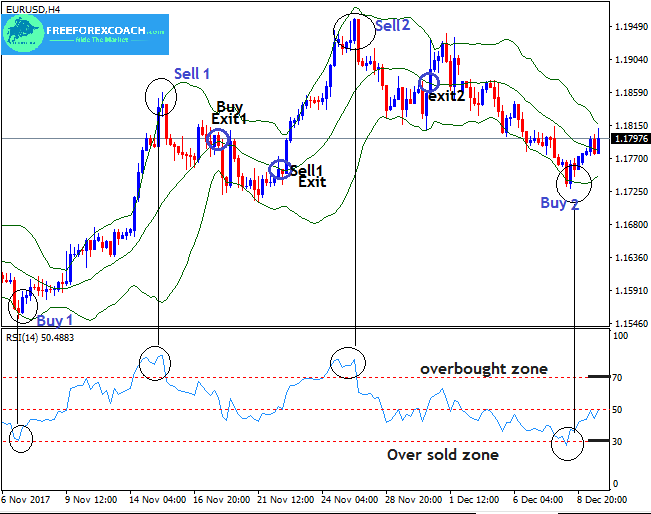
Let’s take a look at the example below

Looking at the chart above, you will see how these indicators can give good trade signals when combined together.
As the Bollinger bands follow the price movement, they tend to act as Support and resistance. The RSI helps to identify the overbought and oversold conditions in the market.
So the entry signals are when the RSI shows overbought or oversold market conditions as price moves on the Upper or the lower band respectively.
Buy signal( RSI oversold + Lower band support)
Sell signal( RSI overbought + Upper band resistance)
Exit Signalson the Chart Above
The exits on the signals above is when the candle closes below/above the middle band from the from the lower/upper band i.e;
- Buy exit (price from upper band and closes below middle band) e.g Buy exit1 for Buy1 on the chart above
- Sell exit (price from lower band and closes above middle band) e.g Sell exit 1&2 for Sell 1&2 on the chart above
In Conclusion
Trading using multiple indicators in forex is profitable when applied well and can be used on any kind time frame.
With forex trading, it is possible to still make a loss even if you choose to use all the indicators at the same time.
So you don’t need to crowd your charts with more indicators thinking you will get a perfect strategy.
Most of these indicators provide the same information. Therefore, for better results, combine indicators from different categories.
Like we always say anything can happen in the market, make use of stop loss and other risk management tool to minimize losses and to protect your account from large draws.
How Does Greed Impact your Forex Trading Success?
There are several ways greed can impact your Forex trading success. Firstly, greed can make you abandon your well crafted trading strategy in favor of impulsive and speculative actions. Instead of adhering to predetermined entry and exit points based on technical or...
-
- Topic
- Voices
- Last Post


