
price confirmation indicators on a chart pattern tell you when to buy or sell. You can also use at these indicators to determine whether you should keep in a trade or cut losses and exit.
However, price indicators work best when using technical analysis to trade. In case you’re using technical chart analysis to trade forex, these indicators will act as evident for your pattern confirmation.
As your trading set up unveils, the confirmation indicators will complete your trading pattern. In other wards, it should be the last thing you see form on your pattern before you take action. In that case, you must have a trading pattern you follow to trade for these indicators to have meaning.
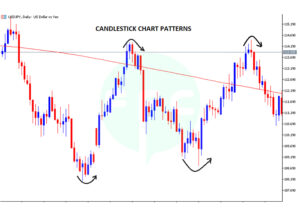
“Patterns;” As price moves up and down, it forms patterns. Your pattern will appear depending on the chart you are using. It can be bar, line or candlestick chart. Since most of us use candlestick chart, we shall consider the candlestick chart patterns.
There are so many chart patterns out there, but that is not the point now as long as what you have fits your strategy. what matters is, you need to notice or take keen when these price confirmation indicators appear on your trading pattern.
Therefore, before you take a trade position, wait for price confirmation signal. In the same way, exit trade only when price confirms that you should do so.
Every time these indicators appear on a chart, something happens. It simply means, the market is trying to tell you something.
In this article we shall mainly look at some of the best price confirmation indicators you should use on your trading setup strategy. Without wasting time, let’s dig in;
How to use price confirmation indicators to enter and exit trade positions?
Candlestick patterns confirmation
If you have been trading, you know what candlesticks are. But if you are a beginner, candlesticks(Japanese candlesticks) are simply the graphical representation of price movements for a given period of time.
Candlesticks appear in different shapes, color, number and sizes. Each candlestick has a different significance on the market chart. That is to say,when you look at these candlesticks patterns, you can tell what price might do next.
To day, our area of interest is candlestick patterns as reversal and continuation indicators.
The Reversal Candlestick Patterns.
To mention but a few, the most significant reversal candlestick patterns include,
- The Morning and evening stars,
- Bullish and bearish engulfing candlestick pattern.
- Doji.
- Shooting star.
- And a hammer.
The reversal candlestick patterns can be bullish bearish.
Bullish Reversal Candlestick Pattern
Suppose, your aim is to buy after a long exhaustion of a downtrend. If a bullish reversal candlestick pattern appears, it is a clear indication that a trend is likely to change direction/reverse.
For example, the morning star, hammer, doji and bullish engulfing candlestick pattern.
In addition to that, if a reversal candlestick pattern let’s say a bullish engulfing, forms at the completion of your trading setup for a long trade, it is a good indicator that price will trend upwards. Buy after confirmation.
Formation of another bullish candlestick after the pattern gives a reliable confirmation for your trade.
But what if a bearish candlestick pattern forms instead! Then wait to take trade until you get another confirmation signal.
Bearish Reversal Candlestick Pattern
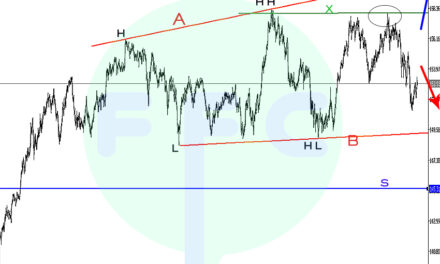
For short signals to trade, you should consider a bearish reversal candlestick pattern.
A bearish reversal candlestick pattern at the completion of your trading setup for a short, is a good indicator that price will fall to your direction.
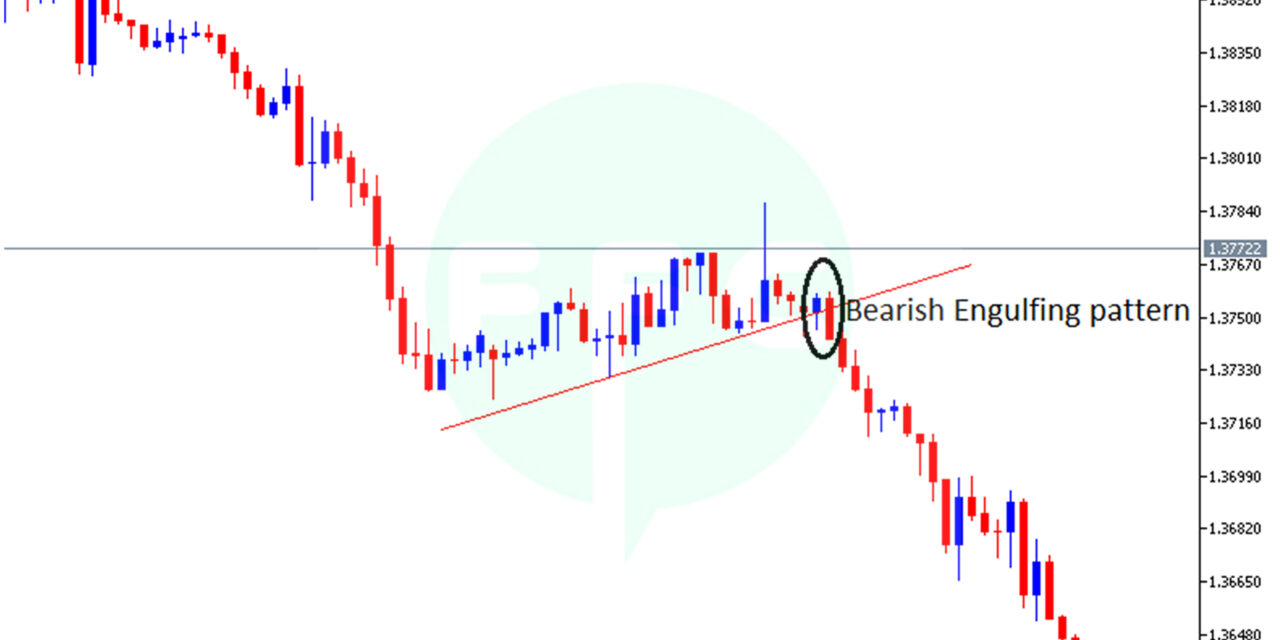
It can be a shooting star, an evening star, bearish engulfing or a doji pattern. Take trade after the formation of another bearish candlestick.
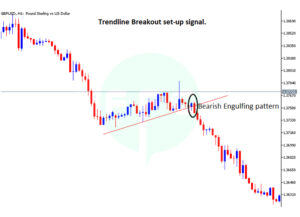
From the above chart, price broke a trendline with a bearish engulfing candlestick pattern. It is marked with a black circle. This is a strong signal that the trend is likely to continue falling for some time. Then the formation of the next bearish candlestick confirms the signal to sell.
Continuation Candlestick Patterns
The Continuation Candlestick Patterns indicate that the initial trend is still strong and likely to rally for sometime.
For examples, when the three soldiers candlesticks appear in an uptrend. When the three crows form in a downtrend. High chances are that a trend is likely to continue in its initial direction.
However, the three soldiers candlesticks pattern and the three crows are also reversal patterns. The three soldiers candlesticks pattern is a trend continuation indicator when in an uptrend. Whereas, the three crows is continuation pattern when in a downtrend.
Another candlestick pattern you should consider is the Marubozu candlestick Pattern. it is can form both in the uptrend and the downtrend. The difference is the color. The Marubozu is a strong price confirmation indicator for a continuation rally in the trend.
If you are in a trade and these form opposite your prediction, it’s time to think about cutting losses and exit trade.
Price Momentum
Another important price confirmation indicator is momentum. If you have been in the Forex market, it’s clear that price never moves at the same pace and direction all the time.
Sometimes price is very fast, steady and strong. Other times its fast and choppy. While some times it’s slow or doesn’t move at all.
In other wards, price momentum is simply a shift/change in price movement. So, when is it good time to trade? trade when price is fast, steady and strong. Avoid the market when price is slow and choppy.
How do you read price momentum?
If you are in an uptrend and price starts to slow down to the upside as it moves towards the downside. The reverse is true when in a down trend.
Since you now know what price momentum is, it’s time put it work. If you can carefully study price movements on your chart, you can tell these changes in prices. It will also help you to see the support and resistance levels and the areas of trend exhaustion.
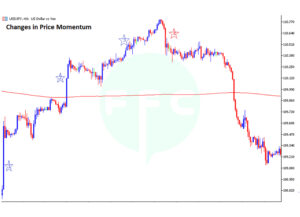
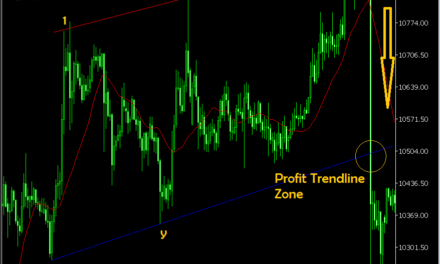
From the above chart, price started strong forming large candlestick (area marked with star 1). It then suddenly slowly slowed down showing weakness to the uptrend.
Area marked with star 2, we see how price picked up again but this time not like before. Here the uptrend still showed strength but you can tell there was change in volume of buyers. prices continued to rise but this time at a very slow pace. Area marked with star 3. You can you tell the complete change in the pace atwhich price was moving.
Later, price eventually changed direction (star4) and after a short congestion it completely fell to the downside.
Most times when this happens, it’s a signal for a shift in momentum which signals possible trend reversal.
Also if price reaches strong levels of support and resistance, it tends to slow down and gets in congestion. The shift in price speed is momentum.
If you trade support and resistance or reversal strategies, again in momentum/price speed is a signal that a new trend is starting. The signal is valid to the reversal direction.
For break-out traders, a gain in momentum after a breakout, indicates a strong trend a head.
Like i said earlier, a slow down in price movements is an indicator for trend exhaustion or price is approaching support and resistance levels.
In case you are already in a trade and price starts to show these changes, it may be a signal for you to exit trade. Also, when price speed increases opposite to your predicted direction. Oscillators are one of the best indicators to use to measure price momentum.
Moving Averages Indicator
The moving average indicator is one of the simplest and best indicators you should add to your trading chart.
With a on a chart, moving average indicator, you can clearly see where the trend is going. It also shows you changes in price momentum since it is a price follow indicator.
When price speed is high, the moving average moves a way from price. As the speed slows down, the moving average gets closer and sometimes moves through the price/ candlestick chart.
And when the moving average crossover with price, the trend changes direction.
Final word
To get a strong price confirmation indicators for your trade, combine all the above three.
Momentum is a leading indicators, it gives signals before they happen.
Candlestick patterns are lagging indicators, therefore can be used for confirmation
An added technical oscillator will help to show you the overbought/oversold areas(trend exhaustion points)
The moving average is a trend following indicator. with this you can tell the direction of a trend
Last but not least, support and resistance levels show areas where price is likely to reverse or change direction.
With all the three indicators combined, it will strengthen your confirmation as well as reduce possible fake-out signals.

